· Talweg Team · Tutorials · 5 min read
Real-Time Cybersecurity: Low-Latency Log Joins & Enrichment
Raw security logs are useless without context. Learn how to perform sub-second temporal joins in Flinkflow to enrich firewall logs with asset and user metadata for instant threat detection.
In modern cybersecurity operations, speed is everything. When an intruder breaches a network, the difference between threat containment and a full-scale data breach is measured in seconds.
Yet, security operations centers (SOCs) are constantly flooded with raw system logs. A typical firewall log looks something like this:
{"timestamp": "2026-06-12T10:00:05Z", "source_ip": "10.0.0.50", "dest_ip": "172.16.2.21", "port": 443, "bytes": 5042}On its own, this log is virtually useless. It contains zero actionable context. To determine if this is a malicious action, security teams must answer critical questions:
- Who is behind the IP
10.0.0.50? (Is it a service account, a general employee, or an administrator?) - What is the target asset
172.16.2.21? (Is it a public web server or a sensitive customer database?) - Does this user have privileges to access this asset?
If you wait to answer these questions until logs are written to a SIEM or database, you’ve already lost the battle. Threat detection must happen in-stream, with sub-second latency.
🏗️ Where Apache Flink Fits
To enrich logs in real-time, your processing engine must handle massive throughput while performing complex stateful operations. This is where Apache Flink excels.
Flink allows you to join high-velocity log streams (millions of events per second) with lookup datasets (such as Active Directory user lists, asset catalogs, and privilege tables).
Rather than querying an external SQL database for every single log entry—which would crash the database and introduce unacceptable latency—Flink maintains a local, distributed copy of this lookup data. Flink then performs a Temporal Join (a join against a slowly changing dimension table at a specific point in time), ensuring that every log is enriched with the exact user and asset state active when the event occurred.
⚡ Declarative Log Enrichment with Flinkflow
With Flinkflow, configuring this complex streaming join requires zero Java boilerplate. You declare the join and enrichment topology directly in YAML.
Here is a complete pipeline demonstrating how to ingest firewall logs, perform a lookup join against an asset and user directory, and route anomalous events:
name: "Real-time Security Log Enrichment"
parallelism: 4

steps:
  # Step 1: Ingest high-velocity firewall logs from Kafka
  - type: source
    name: firewall-logs-kafka
    properties:
      topic: "security.firewall"
      bootstrapServers: "kafka:9092"

  # Step 2: Look up user profile from Azure Active Directory / Entra ID
  - type: lookup
    name: enrich-with-azure-ad
    properties:
      provider: "azure-ad"
      tenantId: "${AZURE_TENANT_ID}"
      clientId: "${AZURE_CLIENT_ID}"
      clientSecret: "${AZURE_CLIENT_SECRET}"
      lookupKey: "source_ip"
      enrichFields:
        owner_username: "displayName"
        owner_role: "jobTitle"
        department: "department"
        is_admin: "showAdminPrivileges" # Dynamically resolved from AD security groups

  # Step 3: Analyze the enriched event in real-time for security anomalies
  - type: process
    name: threat-evaluator
    language: python
    code: |
      import json
      event = json.loads(input)

      # Extract enriched fields
      username = event.get("owner_username", "Unknown")
      is_admin = event.get("is_admin", False)
      sensitivity = event.get("target_sensitivity", "low")
      dest_ip = event.get("dest_ip")

      # Flag non-admin users accessing high-sensitivity database assets
      if sensitivity == "high" and not is_admin:
          event["alert_triggered"] = True
          event["alert_severity"] = "CRITICAL"
          event["alert_message"] = f"User '{username}' (Non-Admin) is accessing high-sensitivity asset at {dest_ip}"
      else:
          event["alert_triggered"] = False

      return json.dumps(event)

  # Step 4: Filter out standard logs, keeping only triggered alerts
  - type: filter
    name: alerts-only
    language: python
    code: |
      import json
      event = json.loads(input)
      return event.get("alert_triggered", False)

  # Step 5: Route critical alerts to the Security Dashboard & PagerDuty
  - type: sink
    name: security-dashboard-webhook
    properties:
      type: webhook
      url: "https://alerts.security.talweg.ai/v1/ingest"
☁️ Direct API Lookup vs. Local Cache Sync
In the example above, Flinkflow makes asynchronous non-blocking REST calls to the Microsoft Graph API to fetch directory details. While this is simple to configure, executing external HTTP requests for millions of events per second will hit rate limits.
For high-velocity streaming setups, we recommend Local Cache Synchronization:
- Use Flinkflow to consume Azure AD delta query logs or directory sync events via an event hub.
- Continually populate a local state table (e.g., RocksDB or a sidecar Redis instance).
- Perform the lookup join against this local table, maintaining sub-millisecond lookups without hitting external Graph API limits.
🛠️ The Mechanism: How Flinkflow Ensures Sub-Second Latency
Performing temporal joins on massive streams requires optimizing three layers:
1. In-Memory Temporal Tables
Flinkflow caches lookup tables (like corporate_directory) locally within Flink’s task managers using RockDB. Update streams (e.g., a user change in Active Directory) are consumed continuously. When a firewall log arrives, the join happens in-memory with sub-millisecond lookup latency, bypassing external database roundtrips.
2. Time-Travel / Watermark Alignment
Temporal joins in Flink respect event-time. If logs arrive slightly out of order due to network jitter, Flink uses Watermarks to align the stream, ensuring that a log is joined with the metadata state that was valid at the moment the event happened, rather than the wall-clock time the log arrived.
3. High-Throughput Filtering
By filtering out non-anomalous traffic immediately after the enrichment step, Flinkflow reduces the write load on downstream SIEMs and security dashboards by over 99.9%. Only the critical, context-rich alerts are emitted.
🚀 The Result
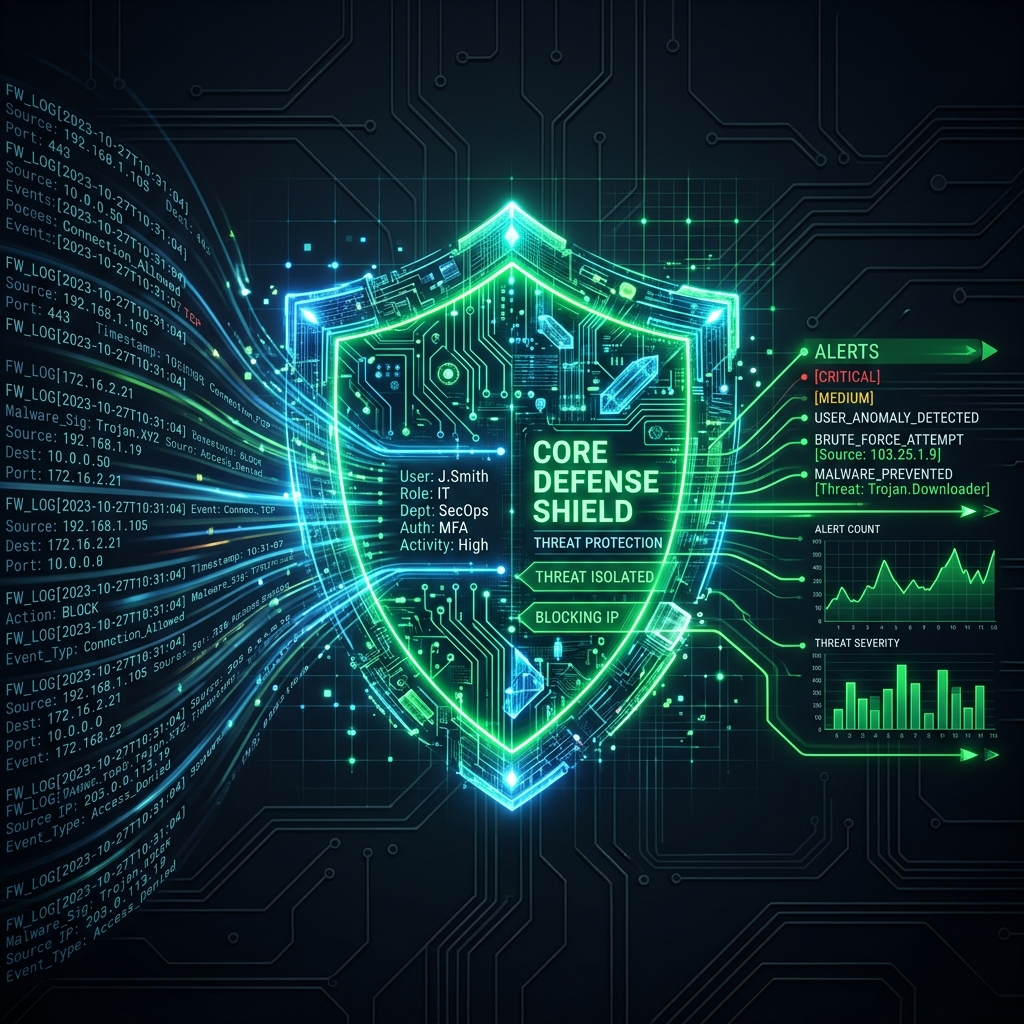
By shifting log enrichment from the database to the streaming pipeline, security teams transform raw, cryptic IP logs into actionable, context-rich narratives:
Raw Event:
10.0.0.50connected to172.16.2.21on port443.Enriched Event: CRITICAL: Non-Admin user
J.Smith(Marketing Dept) is accessing High-Sensitivity DBprod-customer-secrets(172.16.2.21) on port443!
All of this happens in under 200 milliseconds from the network packet being registered to the alert showing up on the security dashboard.
🏁 Get Started with Flinkflow
Ready to build low-latency log pipelines for your infrastructure?
- Explore the Code: Head over to the Flinkflow GitHub Repository.
- Read the Docs: Read our complete guide to joins and lookups.
- Discuss: Connect with our engineers on Zulip to discuss stream enrichment patterns!